
What is Quality Improvement?
Quality improvement refers to the changes required in the process, characteristic, specifications and ability to serve the needs of the end user in making and delivering a product or service to the customer. Usually this is required when a product or service does not match the customer’s expectations or minimum specifications. Systematic approaches for problem solving and methodologies like PDCA and PROFIT can provide a framework for companies to deliver these quality improvements quickly and efficiently keeping the organization competitive.
Let’s have a closer look over these models:
P = Problem identification
R = Root cause analysis.
O = Optimal solution based on root cause(s).
F = Finalize the implementation of corrective action.
I = Implement the plan.
T = Track the success of the implementation and verify that the desired outcomes are met.
If these methodologies initially prove ineffective in rectifying the issue, the cycle is repeated. These cycles not only serve as a framework for problem-solving but also for the quality improvement process.
P = Plan
Define the problem and analyze the root causes to determine the corrective action.
D =Do
Implement decided actions and document the process.
C = Check
Compare the expected and obtained results from the plan
A = Act
This step is followed only if the desired results are not achieved, and the plan is executed again.
The PDCA and PROFIT models are time-tested methods that pave the path toward continuous improvement.
The Foundation: 7 Basic Tools for Quality Improvement
Are you ready to embark on the journey of quality improvement within your business? There are seven miracle tools, known as The First Seven, The Old Seven or The Basic Seven coined by Kaoru Ishikawa. These tools are remarkably simple to implement and track.
According to the concept of Kaoru Ishikawa Problems often manifest as “undesirable outcomes of the workplace” requiring a wise and systematic approach for resolution. The methodology should be kept simple to facilitate the workers to be consistent, even when tackling diverse problems.
Let’s explore these seven miracle quality tools that elevate the quality improvement process in the business landscape to new heights.
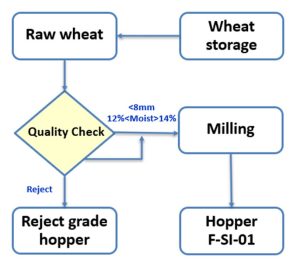
1. Flowcharts: Visualizing Processes
Flow Charts offer a detailed process, graphically illustrating each step in proper sequence. This method for quality improvement serves as a guiding compass amid a sea of problems, showcasing all process steps thoroughly.
Through the utilization of boxes, symbols, and a detailed analysis, critical factors are highlighted with appropriate sequence, while related constraints are alienated with yes/no and if/then choices. Flowcharts stand as unsung heroes in the process of visualization offering remarkable clarity of the workflow assisting business in navigating towards the right direction.
2. Check Sheet :Structuring Data
A Check sheet aids in organizing data categorically. This quality management tool proves increasing benefits for collecting numerous observations,simplifying raw data into categories of observations for easy analysis after.
These sheets reduce the clerical work by indicating the frequency of a particular problem and their occurrence in the specific location, facilitating immediate problem identification and rectification. Analysis of the production processes with the most defects are categorized into a high-priority list to address the issue promptly.
3. Pareto Diagrams: Prioritizing Problems
The Pareto diagram is a quality tool often referred to by experts as the 80-20 rule, signifying that 80% of complexities are caused by 20% potential factors. Named after an Italian economist who proposed that most quality problems result from a few causes, this diagram aids in Identifying the problems which cause the bulk of the quality non conformities and pain points to the customer, these can then be prioritized to improve quality quickly.
These diagrams frequently feature in management presentations.
4. Cause and Effect Diagrams: Understanding Relationships
Also known as fishbone diagrams due to their shape and named after its inventor, ishikawa, these diagrams illustrate a relationship between cause and their impact across various variables. However, this tool has limitations when dealing with problems caused by numerous factors that are challenging to isolate or solve.
Identification of causes via a fishbone diagram assists the problem-solving teams in systematically eliminating probable root causes through corrective actions. These diagrams assist in identifying root causes and enable the organization to go for their possible solutions.
5. Histograms: Analyzing Data Distribution
The primary difference between histogram and check sheets lies in how data is organized; histogram groups data into columns and presents how frequent a condition or variable is present in a data set, vs the check sheet which represents the data in a less visual but categorized way. A histogram is most useful when large data sets need to be analyzed representing multiple variables or conditions. In assisting to analyze the data to form hypotheses and conclusions the histogram provides the basis to include other measures such as the nature of distribution, as well as measures such as average, median, mode and variability.

6. Scatter Diagrams: Revealing Correlations
Recent research indicates that businesses investing on quality improvement methodologies experience an average annual cost saving of 15% annually. Scatter diagrams reveal the relationship between two correlation variables and are employed to evaluate the relationship between two variables and how the data is distributed. In this type of diagram, the horizontal (X) axis stands for measurement value of one variable, while the vertical (Y) axis represents metrics of other variables.
7. Control Charts: Monitoring Process Stability
These control charts serve as controls of the process with upper and lower limits that track the performance of a variable over time based on statistical principles and distribution. These charts facilitate the identification of the trends and signal when the process veers out of control.
The process output is periodically measured, and if it is suspected to exceed predetermined limits, investigation is conducted to determine the causes, and corrective action is justified economically. Control charts are prepared with the mean, upper control limit (UCL), and lower control limit (LCL) to authorize the process. When the storms of problem looms on the horizon, control charts act as sounding alarms, guiding business to safe harbor.
Conclusion: Maximizing Quality Improvement Efforts
A survey conducted on prioritizing quality improvement assessed that, on average, a 12% increase in customer satisfaction is achieved by implementing effective quality management strategies.
With these findings, one truth emerges clearly and resolutely: the journey towards excellence is achieved through the adaptability and proper utilization of the right tools.
With correct implementation of the aforementioned tools, a business can embark on a transformational journey.
Leanmanufactures.com can assist you in shaping a future on your own terms with unparalleled services of quality control plan services. Join us today to empower excellence and unlock the potential success that awaits!
